Height4.2 ft (1.3 m)Period15 sDirectionWNWTemp.59.2 °F / 15.1 °CWind—
View reading and chart →
Region notes
California buoy monitoring for surf windows surf report and buoy data
California is one of the better-covered coastlines for public buoy data. That makes it a useful baseline for understanding how observed buoys and model points complement each other. Start with the nearest recent reference, then check wind, tide and official marine information for the specific beach.
How to read this coverage
This page brings together surf, swell and wave conditions for California buoy monitoring for surf windows surf report and buoy data. SwellOracle separates real instrument observations from marine model points so you can understand what you are seeing before making a decision. Current coverage includes 30 recent observations and 1 model points; availability can vary by source and update time.
- Check the timestamp and source before comparing readings.
- Combine height, period and direction with your coastline orientation.
- Use models as context, not as an automatic substitute for a real buoy.
Observed buoys are the first reference
Stations such as Harvest, Point Reyes and other NOAA/NDBC assets can show whether a northwest, west or south swell is actually present offshore.
SwellOracle highlights real wave stations separately from DART or non-wave stations so users do not build alerts on data that lacks swell height and period.
Use period and direction together
A long-period northwest swell can behave very differently from a shorter-period west swell, even when heights look similar.
California also has many sheltered and exposed zones, so direction determines whether a buoy reading is relevant to a particular break.
Where models help
Model points help when a user is zoomed into an area away from a preferred buoy, or when comparing regional trends beyond one station.
The model should not replace the buoy when a good observation exists. It gives context around the observation.
Northwest, west and south swell exposure
Northwest swell is a major reference for many exposed northern and central California coasts, while west swell approaches more directly. Southern California can also receive south swell that is less relevant to north-facing sections.
The Channel Islands, headlands and curved bays create shadow zones. A strong offshore observation may be accurate while a protected beach remains small, so compare direction with coastline orientation before comparing height.
A simple California buoy workflow
Start with a recent physical observation and check its timestamp. Read height, period and direction together, then compare nearby stations to see whether the signal is regional or limited to one location.
Use the California model for spatial context and a camera or local report as the final reality check. Do not use a single buoy reading as a surf-quality or safety guarantee.
Available coverage
30 recent observations
1 model points
2 reference stations
Latest regional observation:
Height2 ft (0.6 m)Period11 sDirectionSWTemp.66.2 °F / 19 °CWind—
View reading and chart →
Height0 ft (0 m)Period—Direction—Temp.32 °F / 0 °CWind—
View reading and chart →
Height13.5 ft (4.1 m)Period8 sDirectionNNWTemp.55.2 °F / 12.9 °CWind—
View reading and chart →
Height5.6 ft (1.7 m)Period18 sDirectionSSWTemp.71.4 °F / 21.9 °CWind—
View reading and chart →
Height5.2 ft (1.6 m)Period17 sDirectionWSWTemp.71.6 °F / 22 °CWind—
View reading and chart →
Height7.9 ft (2.4 m)Period11 sDirectionWTemp.65.3 °F / 18.5 °CWind—
View reading and chart →
Height2.8 ft (0.9 m)Period13 sDirectionWTemp.58.3 °F / 14.6 °CWind—
View reading and chart →
Height4.6 ft (1.4 m)Period17 sDirectionSSWTemp.72.9 °F / 22.7 °CWind—
View reading and chart →
Height11.5 ft (3.5 m)Period10 sDirection—Temp.61 °F / 16.1 °CWind—
View reading and chart →
Height13.8 ft (4.2 m)Period11 sDirectionNNWTemp.68.5 °F / 20.3 °CWind—
View reading and chart →
Height9.8 ft (3 m)Period8 sDirectionNWTemp.51.8 °F / 11 °CWind—
View reading and chart →
Height4.9 ft (1.5 m)Period17 sDirectionSWTemp.71.6 °F / 22 °CWind—
View reading and chart →
Height4.3 ft (1.3 m)Period18 sDirectionSWTemp.72 °F / 22.2 °CWind—
View reading and chart →
Height6.9 ft (2.1 m)Period17 sDirectionSSWTemp.73.6 °F / 23.1 °CWind—
View reading and chart →
Height7.9 ft (2.4 m)Period11 sDirectionWNWTemp.63.1 °F / 17.3 °CWind—
View reading and chart →
Height4.3 ft (1.3 m)Period5 sDirection—Temp.—Wind—
View reading and chart →
Height5.2 ft (1.6 m)Period17 sDirectionSSWTemp.73 °F / 22.8 °CWind—
View reading and chart →
Height7.5 ft (2.3 m)Period17 sDirectionSSWTemp.73.6 °F / 23.1 °CWind—
View reading and chart →
Height14.1 ft (4.3 m)Period11 sDirectionNNWTemp.59 °F / 15 °CWind—
View reading and chart →
Height14.1 ft (4.3 m)Period11 sDirectionNWTemp.65.1 °F / 18.4 °CWind—
View reading and chart →
Height4.9 ft (1.5 m)Period18 sDirectionSWTemp.72 °F / 22.2 °CWind—
View reading and chart →
Height9.2 ft (2.8 m)Period11 sDirectionWNWTemp.54.1 °F / 12.3 °CWind—
View reading and chart →
Height6.6 ft (2 m)Period11 sDirectionWNWTemp.59.5 °F / 15.3 °CWind—
View reading and chart →
Height11.5 ft (3.5 m)Period10 sDirectionNWTemp.69.4 °F / 20.8 °CWind—
View reading and chart →
Height3.9 ft (1.2 m)Period18 sDirectionSTemp.73.2 °F / 22.9 °CWind—
View reading and chart →
Height3.6 ft (1.1 m)Period18 sDirectionSSETemp.73.2 °F / 22.9 °CWind—
View reading and chart →
Height13.5 ft (4.1 m)Period10 sDirectionNWTemp.66.2 °F / 19 °CWind—
View reading and chart →
Height1.7 ft (0.5 m)Period10 sDirectionSWTemp.73 °F / 22.8 °CWind—
View reading and chart →
Height4.6 ft (1.4 m)Period17 sDirection—Temp.71.8 °F / 22.1 °CWind—
View reading and chart →
Height5.2 ft (1.6 m)Period5 sDirectionWTemp.70.2 °F / 21.2 °CWind—
View reading and chart →
Height2.6 ft (0.8 m)Period17 sDirectionSSWTemp.72.7 °F / 22.6 °CWind—
View reading and chart →
Height6.6 ft (2 m)Period17 sDirectionSSWTemp.71.8 °F / 22.1 °CWind—
View reading and chart →
History is enabled gradually when reusable, correctly identified observations are available. Models and references without a stored series keep their own page, but do not show historical charts.
Buoy and history FAQs
What buoy information is available for California buoy monitoring for surf windows surf report and buoy data?
The published catalog includes 32 physical or reference stations and 1 model point for this region. Each source identifies its provider, location, data type and history status so observations are not mixed with estimates.
Why do some buoys have no historical charts?
Charts appear only when SwellOracle has a stored series of reusable, correctly identified observations. A station can keep its information page even when there is not yet a sufficient series for a chart.
What is the difference between a physical buoy and a marine model?
A physical buoy or station represents instrument measurements. A marine model estimates conditions at a grid point. Use observations as local confirmation and models as spatial context rather than treating them as equivalent sources.
How should swell height, period and direction be interpreted?
Read all three variables together: height describes the size of the signal, period helps explain its energy and direction shows where it comes from. Coastline shape, depth and local exposure can change what reaches the beach.
Keep tracking your buoys without missing a reading
Open the map, save your favorite buoys and get more context when you decide when to check conditions.
Example: compare a Leadbetter camera with the Harvest buoy
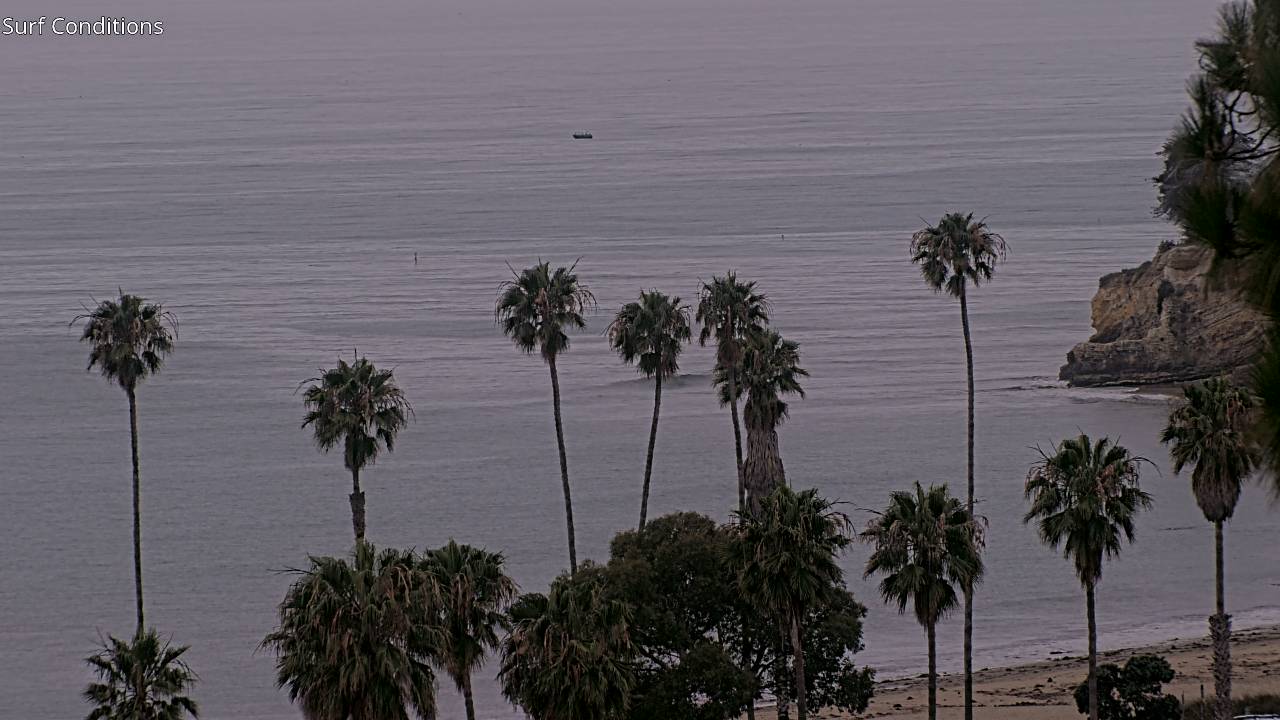
Open the SBCC CoachCam stream near Leadbetter / Santa Barbara
Open reference cameraThis block uses a public link as a visual reference. If we choose a camera with embed permission, it can be shown directly here.
Nearest model
The model reading is not available right now.
The SBCC CoachCam can confirm whether the offshore signal is reaching Leadbetter and the Santa Barbara coast. The California model gives regional swell height, period and direction; the camera shows how that energy appears inside a sheltered, angle-sensitive coastline.
If the model shows long-period west or northwest swell but Leadbetter is small, the local angle, island shadowing or tide may be limiting what reaches the beach.
- Model reference: California coast model
- Primary check: swell period and direction before height
- Reality check: compare visible lines with wind texture and tide
Practical takeaway
California is ideal for using real buoys as confirmation and model points as regional context.